Live floor visibility during the shift
See KPIs, coverage, alerts, and change over time from one operating surface. Not a report you read tomorrow — a view you use now.
The Floor Picture
The whole floor, right now.
A property-wide oversight surface built for live operations. Not retrospective reporting — a current-state view of every metric that matters during the shift.
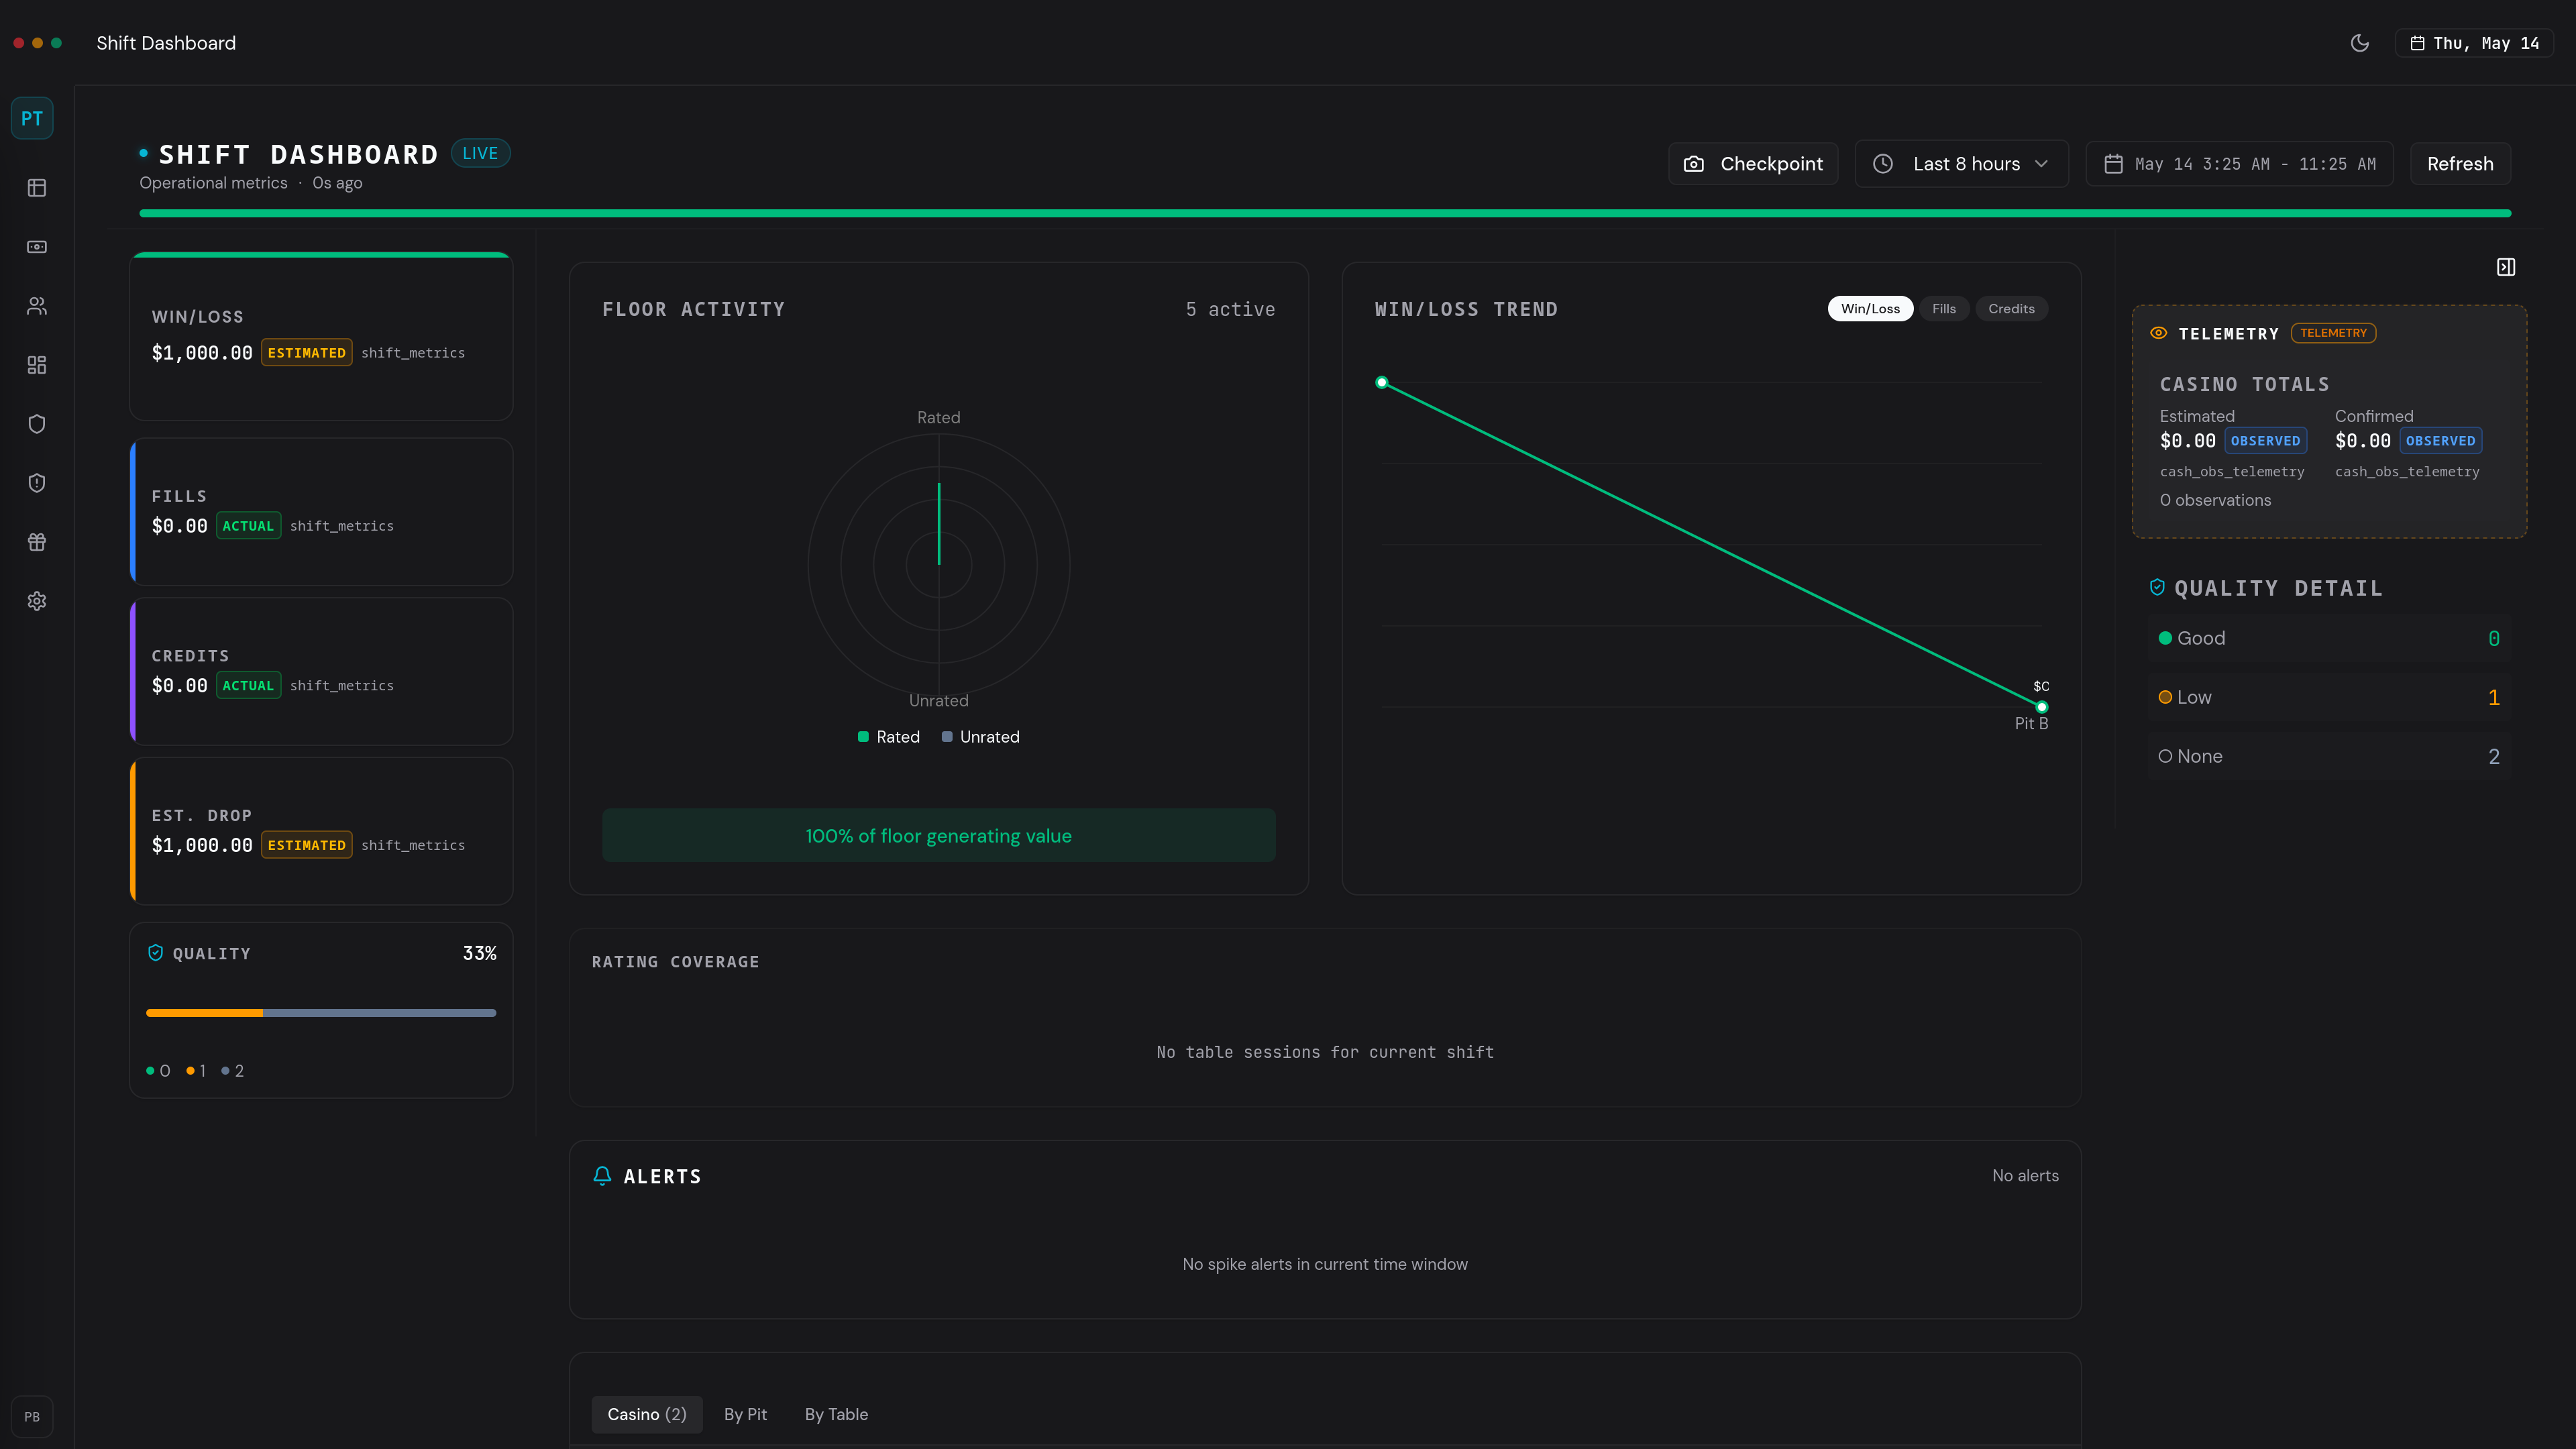
SHIFT DASHBOARD
Floor Operations → Operational Intelligence
Casino-wide KPIs, attribution ratio, cash alerts, and active player roster — the full floor picture, live during the shift.
Casino-wide KPIs
Win/loss, handle, theo, sessions — aggregated across the entire floor in real time.
Attribution Ratio
See which tables are covered, which are idle, and where floor presence has gaps.
Cash observation alerts
Threshold alerts ranked by severity. Progressive indicators during the shift, not after.
Win/loss trend by pit
Performance direction by area. Spot movement before it compounds into a shift-level problem.
Floor activity radar
Rated vs. unrated play at a glance. Know where sessions are active and where play is untracked.
Active players list
Casino-wide roster of who is on the floor right now, at which table, with session status.
Checkpoints
Measure change, not just state.
A checkpoint is a mid-shift snapshot. Mark the floor at any moment, then measure exactly what changed since that point. No legacy system does this.
This is not passive observation after the fact. It is an active management rhythm — freeze a baseline, continue operating, then compare. The delta tells you what the raw numbers cannot.
Mark the floor
Take a snapshot of current KPIs, win/loss, and coverage. The system freezes the state at that moment.
Continue operating
The shift keeps moving. Players arrive, tables turn, cash flows. The checkpoint holds.
Measure the delta
Compare now to then. See exactly what changed — which metrics moved, by how much, in which direction.
Drill-Down
From the floor to the table.
Oversight is not just summary metrics. It leads to actionable inspection — from property view to pit, from pit to table, from table to seat.
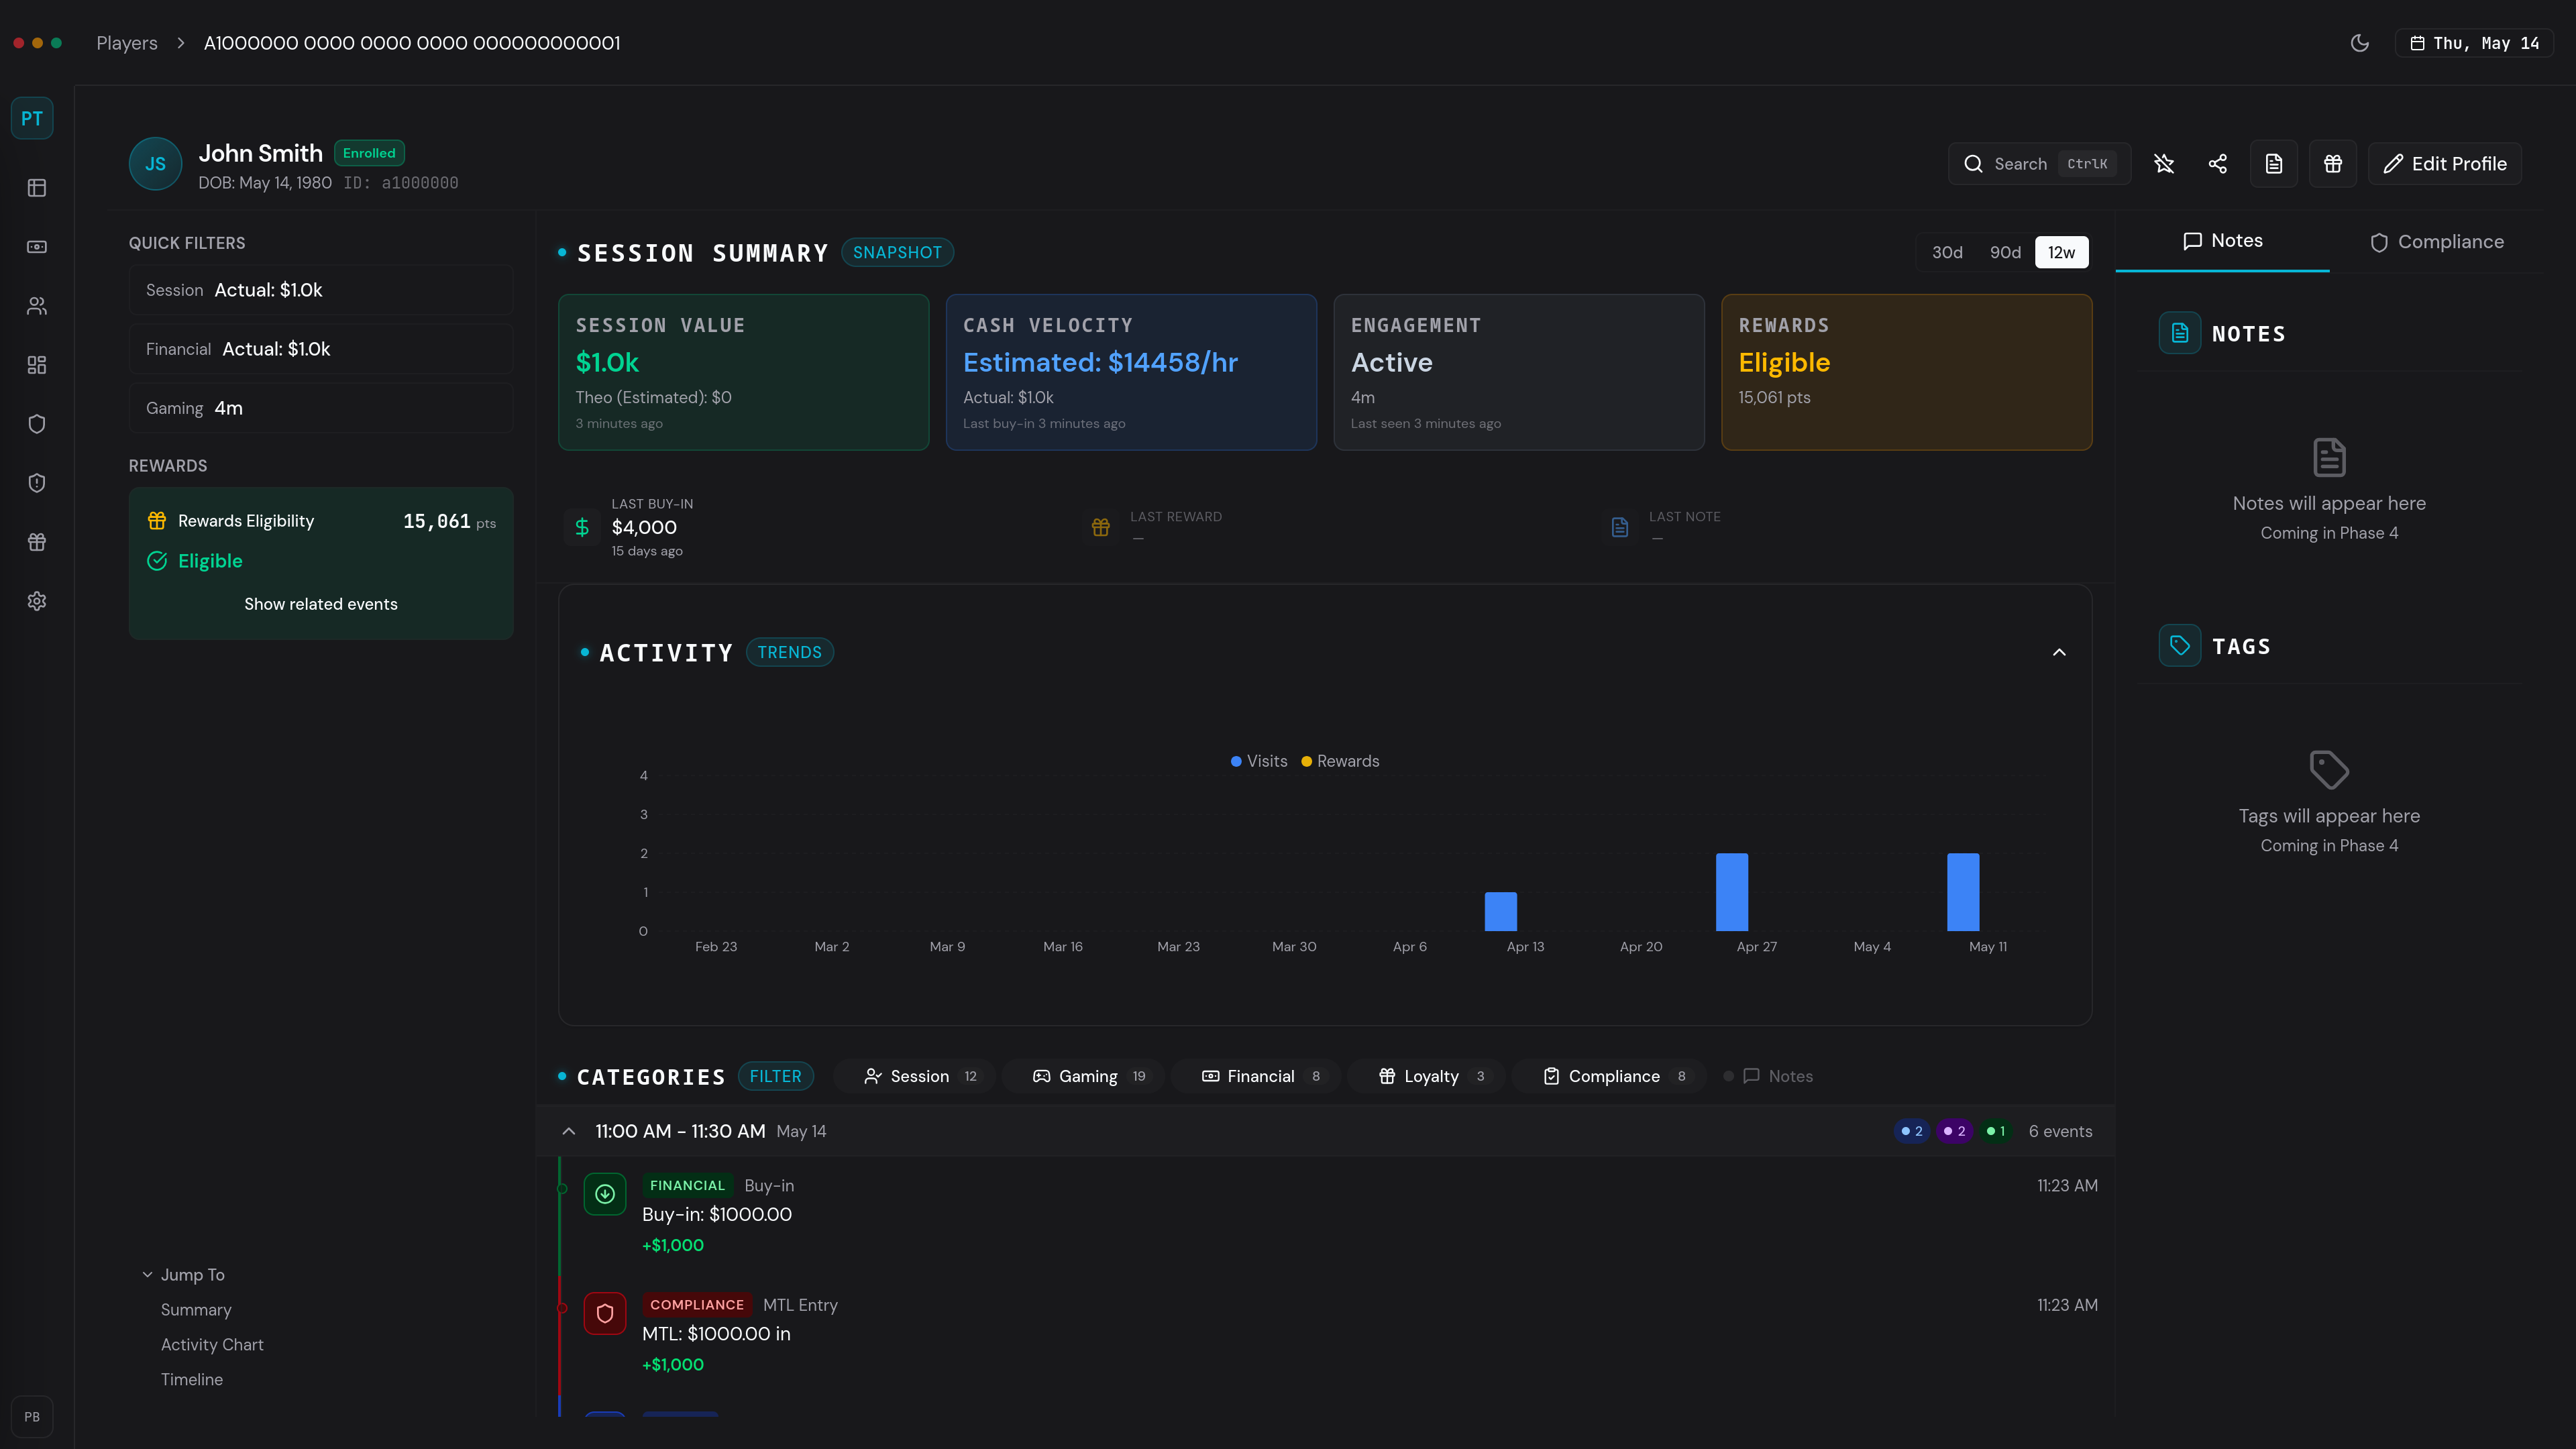
PLAYER 360
Session Tracking → Operational Accountability
Full player operational record surfaced from the pit — identity, visit continuity, rating slips, financial activity, and filterable interaction timeline.
Table-level view
Every table in the pit with status, session count, and current activity.
Seat map
Visual seat positions showing occupancy, player identity, and rating status.
Player presence
Who is at the pit right now, what they are doing, and how long they have been there.
Inventory context
Chip counts, drop totals, and fill history — table-level financial awareness.
Table analytics
Performance metrics at the individual table level for focused inspection.
In Practice
A shift, start to finish.
This is not a feature walkthrough. It is the actual operating rhythm of a floor supervisor using the system during a live shift.
Arrive on shift
Log in. Smart routing sends you straight to the shift dashboard.
See the floor
KPIs, coverage, alerts, and active players — the full picture in one view.
Set a checkpoint
Mark the floor state. You now have a baseline to measure the shift against.
Monitor the shift
Watch variance, coverage gaps, and alert escalation as the shift progresses.
Inspect where needed
Drill from the floor into a pit, from a pit into a table. Follow the signal.
Continue exploring.
Floor oversight is one operating loop. The system supports three more.